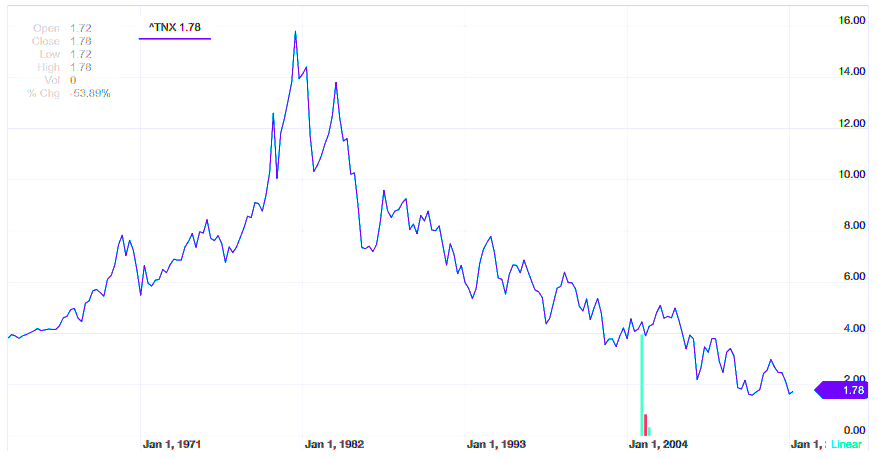
The yield curve inverted and some investors are scared. I never thought I'd ignore an inverted curve, but think about this. Interest rates increase before inverting and signaling a recession. Interest rates are at historic LOWS and do not curtail borrowing.
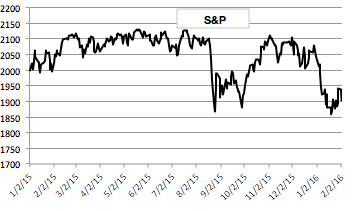
Look at these graphs from StockCharts.com. The curve inverted at a much higher rate before the stock market decline in 2000.
And again before the recession of 2007:
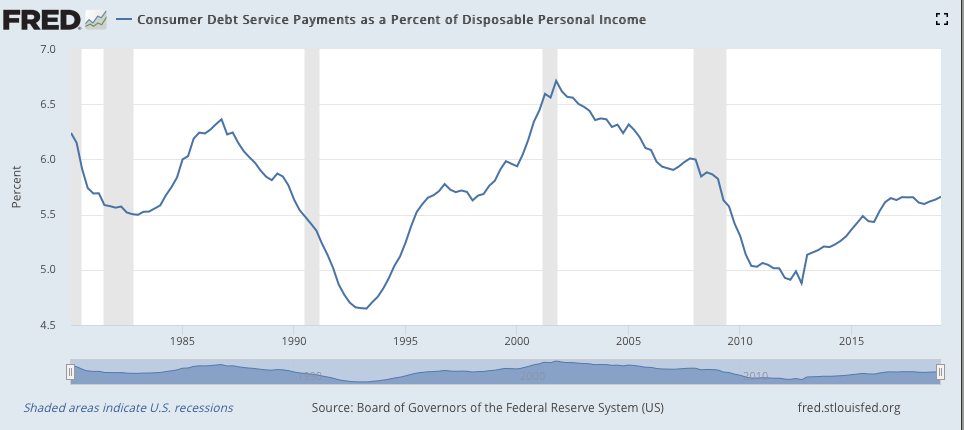
Neither the consumer nor corporations have trouble borrowing at these low rates.
The consumer will continue to drive this economy and stock market to new highs.